

During this weekend i tackled a challenging task: to try to explain one of my recently published papers with an infographic. My first thought was to write a blog post (maybe i’ll do it as well), but i was intrigued by the idea of lumping a couple of years of work into a few tiny lines. Although attracted by the immediacy of infographics, i never used this tool, and it sounded just the right moment to give it a go. So, i went to the Canvas site and chose a fitness club advertisement as a template. After a bit of playin’ around, that’s what i’ve got:
I admit i’m quite happy with it, even if the making process was not plain sailing at all, at least for me. As a first-time user, i think that there’s room for improvement, and i’ll probably do some other attempts. Actually, i enjoyed creating this infographic!
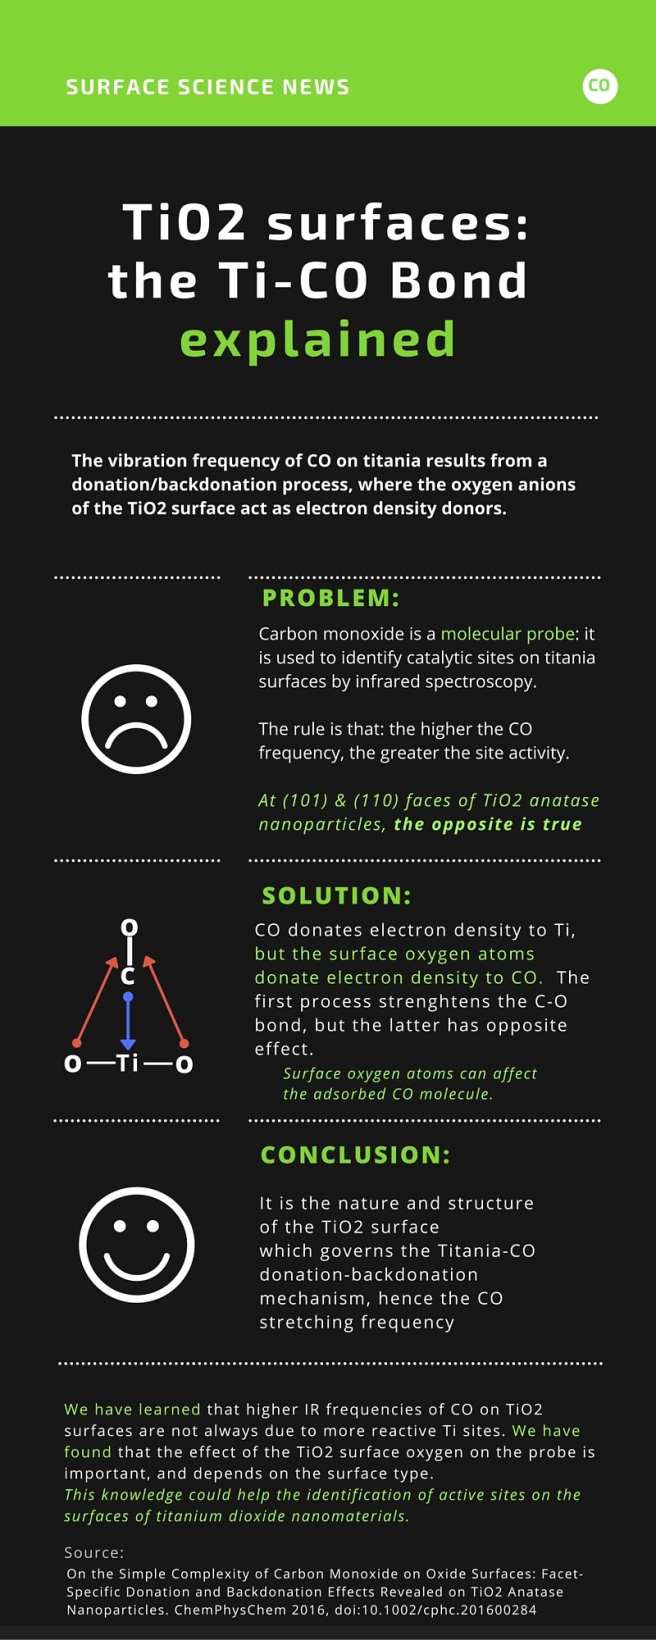
I have published it (the infografic, i mean) in figshare (acceptance rate: 100%, publication fares: 0 €). That’s openaccess – free to download and use. Unfortunately, that’s not true for the paper – not enough funds to make it openaccess as well. Anyway, if you might want to give it a look, here’s the link:
Deiana, C., Fois, E., Martra, G., Narbey, S., Pellegrino, F. and Tabacchi, G. (2016), On the Simple Complexity of Carbon Monoxide on Oxide Surfaces: Facet-Specific Donation and Backdonation Effects Revealed on TiO2 Anatase Nanoparticles. ChemPhysChem. doi:10.1002/cphc.201600284
Another short explanation can be found here, with links to additional material.


